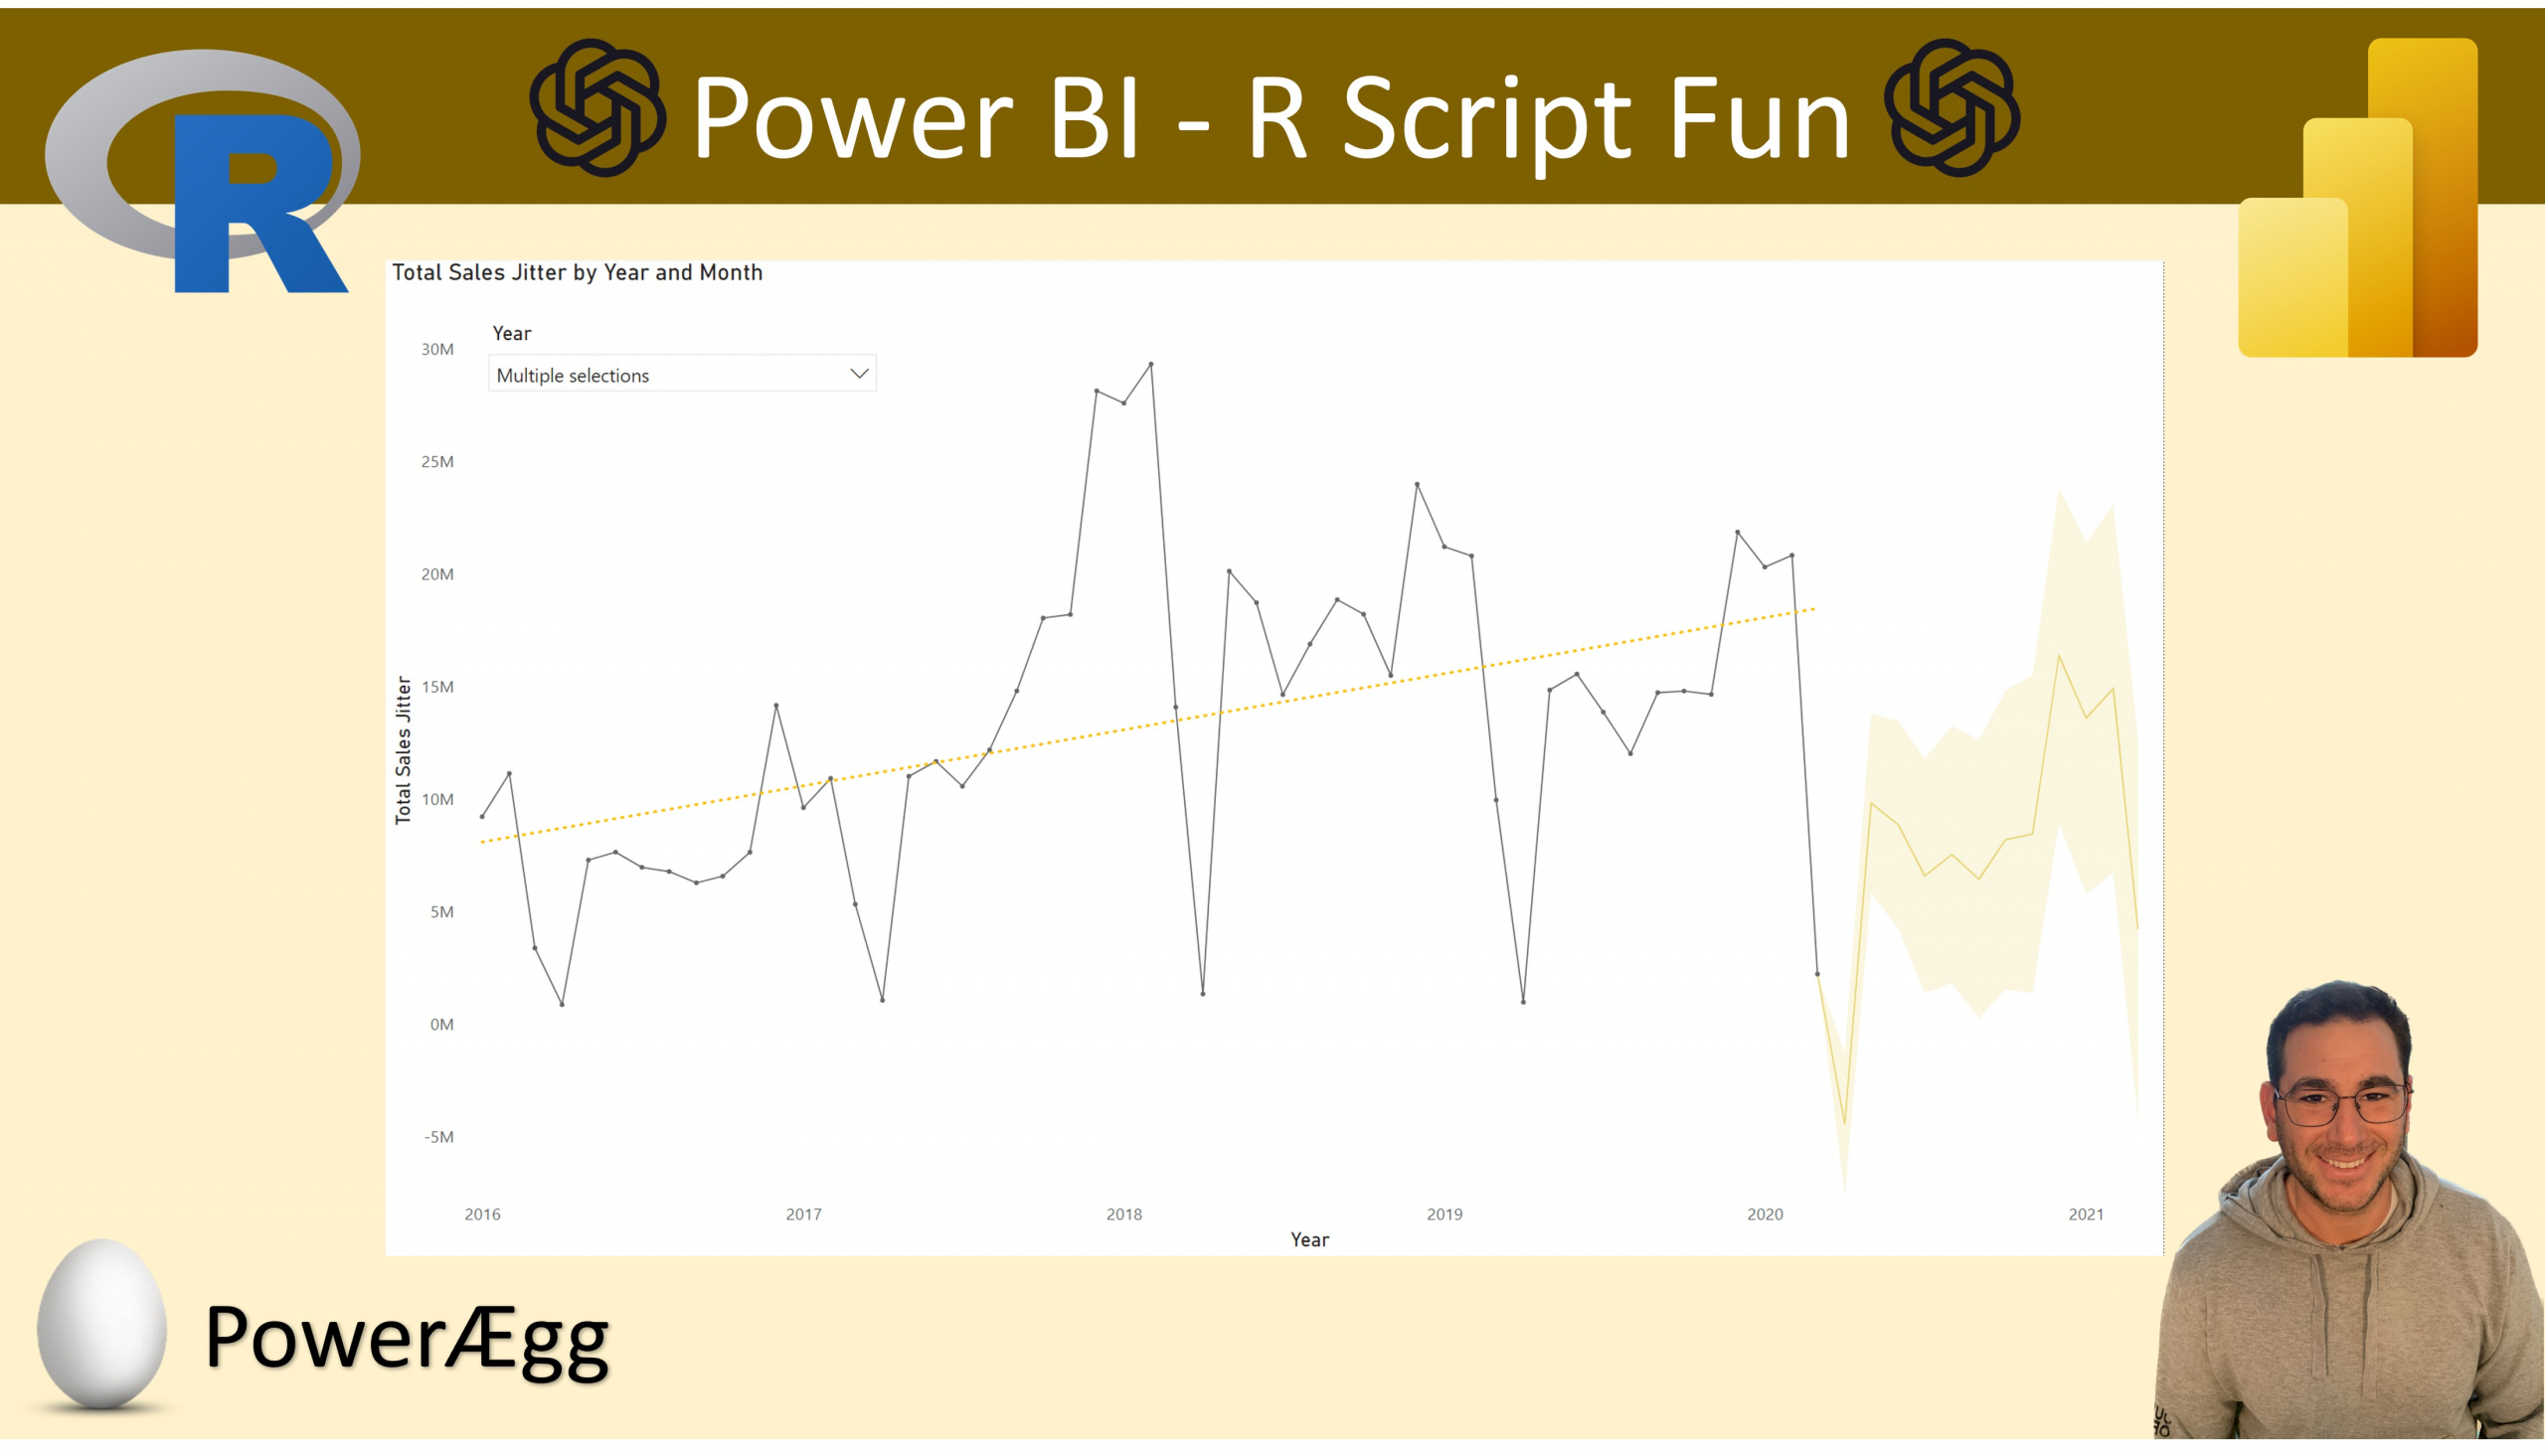
For this video we will look at using ChatGPT to write an R Script query in Power BI. We will look at creating a mutate function that manipulates the sales fact quantity data creating a jitter effect every time the data is refreshed. The end result will be a line chart with the out of the box Power BI forecast, which when the report is updated, simply changes the data we have, making it look live-like.
As always you can find the solution in the GitHub repository, and make sure to subscribe for more videos like this.
Business Case Requirements
- A Sales Line Chart that when updated, moves data points creating a live-like data effect.
- Create this using R Script from ChatGPT.
- The R Script should manipulate the sales quantity data, which in turn will affect the total sales measure.
- Include the Power BI out of the box forecast.
R Script from ChatGPT
library(RODBC)
library(dplyr)
# Define the connection string
channel <- odbcDriverConnect(“driver={SQL Server};server=localhost;database=Contoso 10M;trusted_connection=true”)
# Load the data from SQL Server and join with customer table
contoso_sales_data <- sqlQuery(channel, “SELECT s.*, c.Country FROM dbo.Sales s LEFT JOIN dbo.Customer c ON s.CustomerKey = c.CustomerKey”)
# Filter the data for Germany and create a new column with a jitter effect
contoso_sales_data <- contoso_sales_data %>%
filter(Country == “Germany”) %>%
mutate(jittered_sales = Quantity + runif(n(), -20, 20))
# Disconnect from database
odbcClose(channel)
# View the first few rows of the resulting data frame
head(contoso_sales_data)

